One of the 5 Pillars of the United Nations SDG’s is the Planet. Any SDG’s related to climate fall under this pillar – SDG’s 6, 12, 13, 14, and 15.
Many Technovation participants have a deep interest in solving climate issues. Many teams decide to work on apps to help solve climate issues, and some of our Technovation alumnae have teamed up to solve climate-related SDGs.
They want to share some of their technical expertise with you as you embark on your own app solutions.
Check out their solutions below!
Click on each app icon to learn more and follow the tutorial.
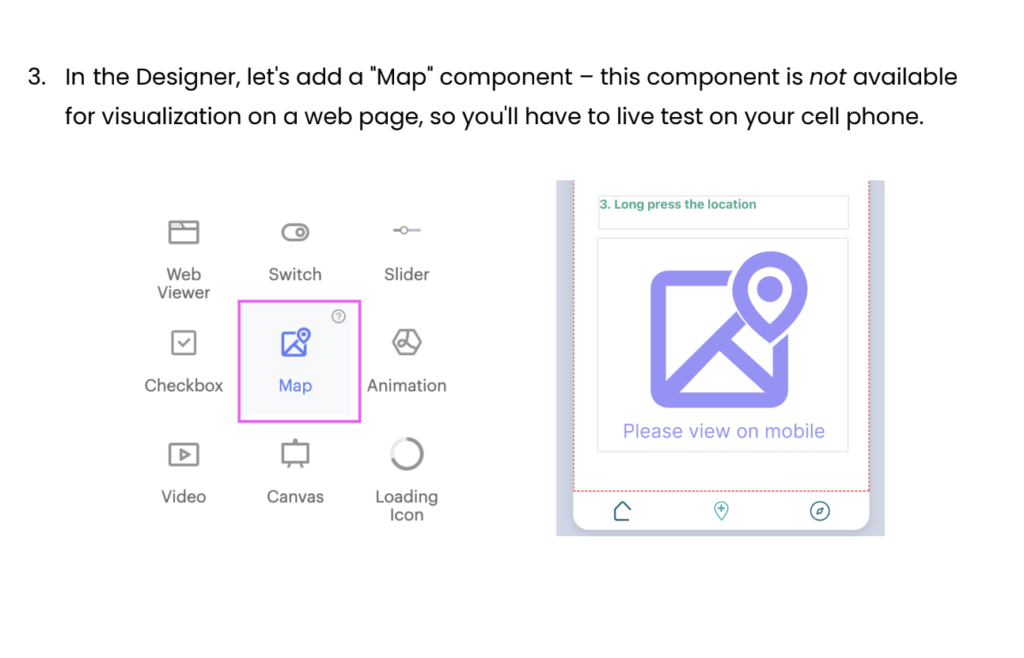
Learn how to display locations on a map in Thunkable, and how to allow users to add their own markers to the map.
Learn how to use cloud data and incorporate images and videos in a data grid in Thunkable.
Learn how to incorporate external website data in your App Inventor app using an Application Programming Interface (API).
Learn how to make a leaderboard so you can challenge your users to gain points and compete against their friends.
dropin'
dropin’ is an app that displays protected water areas on a map. Laura’s written Thunkable tutorial shows you how to use Google Sheets and Map/Marker components to display location-based information on a map in your app.
This is a great way to crowdsource shared location-based information in an app!

Option A
Option A uses cloud data and incorporates images and videos in a data grid using Thunkable. Ana and Zhibek displayed vintage fashion videos in their responsible consumption app. In the video, they show you how to allow app users to select and view videos from a list.
Thinking about adding AI to your SDG 12 app? Here is one idea.
This tutorial shows you how you can use a combination of APIs that use AI to detect text. A user can check a brand tag before they buy to see how sustainable that brand is.
WE Heroes
WE Heroes incorporates external website data using an Application Programming Interface (API) in MIT App Inventor. Arlen and Giovanna used the IUCN Redlist API to display endangered species information in their app.
Thinking about adding AI to your SDG 13 app? Here is one idea.
Would you like to add some AI to your WEHeroes app? This tutorial shows you how you can use the IUCN API to get a list of endangered species, then use the App Inventor ChatBot component to make the information from the IUCN website more age-appropriate for younger users.
Microplastic Mayhem
Microplastic Mayhem includes a leaderboard so users can gain points and compete against friends by collecting nurdles (small microplastic particles found near waterways).
Neki Nature
Neki Nature by Avril provides information to users about endangered species in Mexico. Learn how to use a Data Viewer Grid and Google Sheets in your Thunkable app to display information but also allows for more versatility to add more data to the app.


