- Apprendre ce qu'est une étude de marché et pourquoi elle est importante
- Explorer plusieurs méthodes d'étude de marché
- Menez vos propres activités d'étude de marché pour recueillir des informations sur vos utilisateurs, leurs besoins et le marché existant.
- Utilisez des outils de recherche basés sur l'IA pour identifier vos concurrents, analyser les tendances du marché et recueillir des informations qui alimenteront votre analyse SWOT.
Introduction aux études de marché
L'étude de marché est le processus de collecte d'informations sur l'environnement dans lequel votre solution sera utilisée. À ce stade, vous avez validé votre solution avec les parties prenantes et devriez avoir une bonne compréhension de votre public cible.
Il est maintenant temps d'étudier les concurrents qui traitent déjà des problèmes similaires, les normes industrielles et les tendances du marché.
La réalisation d'études de marché vous permet de prendre des décisions éclairées sur la manière de positionner votre solution, ce qui la rend unique et où se trouvent les meilleures opportunités. Il est possible d'identifier les tendances qui façonnent votre domaine, de reconnaître ce que les autres font bien et de trouver les lacunes ou les besoins non satisfaits que votre idée peut combler. Ces informations réduisent les risques, renforcent votre stratégie et augmentent vos chances de créer quelque chose qui réussira dans le monde réel. Il existe plusieurs façons de mener une étude de marché, et les entreprises combinent plusieurs méthodes pour parvenir à une compréhension globale de leur marché. Passons maintenant en revue certaines de ces principales méthodes.
Recherche de concurrents
La recherche de concurrents consiste à examiner d'autres entreprises, produits ou solutions qui répondent au même problème que votre idée. Elle vous aide à comprendre ce qui existe déjà sur le marché, ce qui fonctionne bien et ce qui pourrait être amélioré.
En apprenant des concurrents, vous pouvez identifier les possibilités de différencier votre solution, d'offrir une valeur unique et d'éviter les erreurs commises par d'autres. Cette recherche est essentielle car même si votre idée est bonne, elle aura plus de succès si elle répond à des besoins non satisfaits ou si elle offre une meilleure expérience que les solutions existantes.
En suivant les étapes suivantes, vous aurez une meilleure idée de vos concurrents et de la manière de vous démarquer. Grâce à ces informations, votre solution se concentrera sur les opportunités réelles, communiquera des avantages clairs aux utilisateurs et guidera vos décisions en matière de fonctionnalités, de messages et de stratégie.
🔍 Identifier les concurrents
Commencez par rechercher des produits, des services ou des organisations qui résolvent le même problème. Considérez les concurrents directs (ceux qui offrent des solutions très similaires) et les concurrents indirects (ceux qui ciblent les mêmes besoins des utilisateurs par le biais d'approches ou de secteurs différents).
Où chercher ?
- Moteurs de recherche (recherche du problème)
- Annuaires de produits (G2, Capterra, Crunchbase)
- App Stores
- Communautés (WhatsApp, Discord, groupes LinkedIn)
- Sources académiques (documents de recherche, études de cas)
- Sites web des concurrents
📝 Recueillir des informations
Étudier leurs produits ou services de manière approfondie. Notez les caractéristiques, les prix, l'expérience de l'utilisateur, les stratégies de marketing et les avis des clients. les avis des clients. Faites attention aux points forts et aux points faibles. Des captures d'écran, des notes ou des feuilles de calcul peuvent aider à organiser ces informations.
⚖️ Comparez avec votre solution
Effectuez une analyse approfondie de chaque concurrent, puis rassemblez les informations clés dans un tableau comparatif, avec votre solution. Quel problème chaque concurrent résout-il ? Consultez l'activité Recherche sur les concurrents ci-dessous.
📊 Rechercher des modèles
L'étude des concurrents peut révéler des tendances sur le marché. Par exemple, si plusieurs concurrents proposent des fonctionnalités similaires, cela peut indiquer ce que les utilisateurs attendent ou apprécient le plus. Inversement, des fonctionnalités rares ou manquantes peuvent représenter des opportunités d'innovation. La visualisation des données, telle que les tableaux de comparaison des fonctionnalités, comme celui de l'activité ci-dessous, peut vous aider à voir les tendances plus clairement et à communiquer les informations de manière efficace.
✅ Agir
Utilisez vos conclusions pour affiner votre idée. Vous pourriez supprimer des caractéristiques inutiles, ajouter des fonctionnalités qui répondent à des besoins non satisfaits ou adapter votre approche marketing pour mettre en évidence ce qui rend votre solution unique. L'étude de la concurrence est d'autant plus utile qu'elle éclaire directement les décisions que vous prenez au sujet de votre produit et de votre stratégie.
💡 Proposition de valeur unique
L'étude de la concurrence et l'analyse du marché vous aident à découvrir votre proposition de valeur unique. En examinant ce que les concurrents font bien, ce qu'ils font moins bien et les besoins des utilisateurs qui ne sont pas satisfaits, vous pouvez identifier les possibilités pour votre solution d'apporter une valeur distincte.
Posez-vous la question :
- Quels sont les problèmes que les concurrents résolvent efficacement et quels sont ceux qui sont négligés ?
- Quelles sont les possibilités d'offrir quelque chose de différent ou de meilleur ?
- Comment notre solution peut-elle combler des lacunes ou répondre à des besoins non satisfaits comme ne le font pas les concurrents ?
ACTIVITÉ 1
Recherche sur la concurrence à l'aide de l'IA
Durée estimée : 45 minutes
Vous pouvez accélérer vos recherches sur vos concurrents en utilisant l'IA pour vous aider à identifier, recueillir des informations et analyser qui sont vos concurrents. Vous utiliserez la feuille de travail ci-dessous comme guide pour les questions à poser. Vous pouvez ensuite copier-coller les informations obtenues du LLM dans la feuille de travail.
1. Ouvrir la discussion LLM
2. Identifiez rapidement vos principaux concurrents
Dans le chat IA, invite :
Je suis en train de créer [ENTREZ VOTRE SOLUTION, EN EXPLIQUANT BRÈVEMENT SES PRINCIPALES CARACTÉRISTIQUES]
Veuillez identifier mes trois principaux concurrents en répondant aux questions suivantes :
[COPIEZ ET COLLEZ LA PREMIÈRE PAGE DE LA FEUILLE DE TRAVAIL, PAR EXEMPLE :]
Nom :
Site web :
- Comment fonctionne ce produit ?
- Quel problème résout-il ?
- Qui est l'utilisateur cible ?
- Quel est leur principal facteur de différenciation/leur proposition de valeur ?
- Quelle pile technologique utilisent-ils (par exemple, cloud public, modèles d'IA spécifiques, ensembles de données) ?
- Quel est leur modèle de revenus/leur structure tarifaire (par exemple, freemium, basé sur l'utilisation, abonnement à plusieurs niveaux
) ? Quel est le prix pour l'utilisateur cible ? - Quels sont leurs principaux atouts ? (Qu'est-ce qu'ils font vraiment bien ? Qu'est-ce que les utilisateurs/critiques apprécient particulièrement ?)
- Quelles sont les faiblesses ou les lacunes ? (Qu'est-ce qui manque ? De quoi se plaignent les utilisateurs ?)
- Quels problèmes cela ne résout-il PAS ?
- Que devriez-vous adopter de leur approche ?
- Que devriez-vous éviter ou faire différemment ?
- Que pouvez-vous améliorer dans leur solution ?
3. Examiner la réponse
Le LLM générera une réponse.
- Recopiez les résultats dans votre feuille de calcul.
- Examinez attentivement chaque concurrent répertorié et les réponses aux questions.
- Voyez-vous des tendances ou des informations intéressantes ?
4. Vérifiez vous-même les concurrents
Il est certes étonnant de voir la quantité d'informations que l'on peut recueillir sur ces concurrents d'un simple clic, mais on ne peut pas toujours se fier aux LLM pour obtenir des informations exactes.
- Rendez-vous sur le site Web de chaque concurrent et prenez le temps d'examiner les informations qui y sont présentées.
- Vérifiez que les informations fournies sont correctes et ajoutez toute information supplémentaire ou tout élément que vous avez trouvé lors de votre recherche sur Internet.
- Demandez au LLM de fournir d'autres liens à l'appui de ses informations. Il pourrait fournir des liens vers des critiques ou des sites spécialisés qui pourraient être utiles et permettre d'approfondir vos connaissances.
5. Identifier les forces et les faiblesses
- Allez à la page 4 de la fiche de travail et regardez le premier tableau de la page.
- Demander à l'IA :
Veuillez identifier 3 à 5 concurrents (y compris ceux déjà identifiés).
Pour chaque concurrent, indiquez
- utilisateurs cibles
- tarification
- principaux atouts
- principales faiblesses
Veuillez fournir les résultats sous forme de tableau.
- Copiez et collez la réponse, qui devrait être un tableau, dans votre feuille de calcul.
- Examinez le tableau, vérifiez son exactitude et recherchez tout élément intéressant qui vous saute aux yeux.
6. Comparez les principales fonctionnalités
- Regardez le deuxième tableau à la page 4 de votre feuille de travail.
- Énumérez les trois principales fonctionnalités de votre application.
- Demander à l'IA :
Voici les 3 principales fonctionnalités de mon application [LISTEZ VOS FONCTIONNALITÉS] Ajoutez mon application au tableau. Pour mon application et chacune des applications concurrentes répertoriées, indiquez si elles incluent ou non cette fonctionnalité. Ajoutez toute remarque utile.
- Copiez et collez la réponse dans votre feuille de travail.
- Vérifiez, contrôlez l'exactitude, ajoutez vos propres notes.
7. Synthèse et stratégie
- Regardez les indications au bas de la page 4 de la fiche de travail.
- Prenez 5 à 10 minutes pour répondre vous-même à ces questions, en vous basant sur les informations que l'IA vous a aidé à rassembler.
- Demandez maintenant à l'IA de répondre à ces questions.
- Comparez la réponse avec votre propre analyse. Quels sont les points communs ? Qu'est-ce qui vous a échappé ?
8. Votre avantage concurrentiel
Faites de même avec les questions de la page 5 de la fiche de travail.
- Prenez 5 à 10 minutes pour répondre vous-même à ces questions, en vous basant sur les informations que l'IA vous a aidé à rassembler.
- Demandez maintenant à l'IA de répondre à ces questions.
- Comparez la réponse avec votre propre analyse de votre avantage. Quels sont les points communs ? Qu'avez-vous manqué ?
- Prenez le temps de mettre en avant votre avantage concurrentiel. Vous devez vous assurer d'en tirer pleinement parti.
Analyse comparative de l'industrie
L'analyse comparative dans le secteur consiste à comparer les indicateurs clés et les normes de performance sur l'ensemble d'un marché afin de comprendre ce qui constitue une « bonne » performance. Alors que l'étude de la concurrence se concentre sur des entreprises individuelles, l'analyse comparative examine la situation dans son ensemble.
L'analyse comparative comprend également des données quantitatives mesurables, plutôt que des données essentiellement qualitatives recueillies dans le cadre de votre analyse de la concurrence. Elle révèle les normes et les attentes au sein d'un secteur, en montrant les points forts des concurrents, les lacunes et les possibilités pour votre produit de se démarquer. L'analyse comparative fournit également un contexte permettant d'évaluer votre propre solution par rapport à un paysage plus large plutôt que par rapport à des concurrents individuels.
Les étapes suivantes vous permettront de vous faire une idée précise des normes du secteur et d'utiliser des données réelles pour orienter vos objectifs et vos améliorations en matière de produits.
🔍 Identifier les mesures
Pour commencer, identifiez les indicateurs les plus importants pour votre solution. Concentrez-vous sur les indicateurs qui reflètent la manière dont une solution répond aux besoins des utilisateurs ou aux objectifs de l'entreprise. Posez-vous la question : Qu'est-ce qui préoccupe le plus les utilisateurs ? Quels sont les facteurs de satisfaction, d'adoption ou de fidélité ? Quels aspects de l'offre d'un concurrent sont considérés comme essentiels par les clients ?
Exemples de secteurs d'activité :
- Applications de livraison de nourriture : Délais de livraison moyens, évaluations des clients, fréquence des commandes répétées
- Commerce électronique : Taux d'abandon du panier, temps de chargement du site web, taux de conversion
- Applications mobiles : Classement dans l'App Store, utilisateurs actifs quotidiens (DAU), taux de fidélisation
- Soins de santé : Temps d'attente des patients, taux de réussite des traitements, taux de satisfaction des patients
- L'éducation : Taux d'achèvement des cours, engagement des étudiants, accessibilité
- Environnement : objectifs de réduction des émissions de carbone, taux de participation communautaire, adoption de pratiques durables, impact écologique mesurable.
- Organisations à impact social : taux de conversion des dons, engagement des bénévoles, portée des programmes, résultats des mesures d'impact
- Organisations humanitaires : temps de réponse aux crises, nombre de personnes aidées, efficacité de la distribution des ressources, satisfaction des bénéficiaires.
Pour les startups de l'IA et de la technologie, les indicateurs clés sont les suivants :
- Engagement/rétention des utilisateurs : Utilisateurs actifs quotidiens (DAU), utilisateurs actifs mensuels (MAU), taux de rétention 7 jours/30 jours
- Satisfaction des utilisateurs : Net Promoter Score (NPS), évaluations des magasins d'applications
- Conversion/monétisation : Taux de conversion gratuit-payant, achats in-app
- Confiance et sécurité : SOC 2, ISO 27001, méthodes d'authentification
- Performance de l'IA : Précision, pertinence, latence, taux d'hallucination
📝 Collecter des données
Une fois que vous avez choisi les indicateurs à étudier, recueillez des informations auprès de plusieurs sources. Certains de ces indicateurs peuvent être difficiles à trouver, et d'autres se trouvent derrière des murs payants. Faites de votre mieux pour étudier ces indicateurs afin d'avoir une vue d'ensemble du secteur.
 Prenez des notes minutieuses et notez l'origine de chaque élément d'information. Il est ainsi plus facile de comparer les concurrents et de vérifier les résultats obtenus.
Où trouver les données :
- Engagement/rétention des utilisateurs :
- Articles universitaires et études de recherche
- Blogs sectoriels (Amplitude, Mixpanel, Pendo)
- Rapports sectoriels (High Alpha/OpenView, Benchmarkit, SaaS Capital)
- Satisfaction des utilisateurs :
- Sites d'évaluation de logiciels (G2, Capterra)
- Critiques et évaluations de l'App & Play Store
- Rapports sectoriels (Qualtrics, ChartMogul)
- Conversion/monétisation
- Dossiers d'investisseurs (Crunchbase, Slideshare)
- Marketing, sites industriels (OneSignal, Qualtrics)
- Prix/volonté de payer
- Pages de prix des concurrents
- Plateformes d'analyse (UXCam, AppTweak, statistiques d'optimisation de l'App Store 2025)
- Performance de l'IA
- Sites d'évaluation technique
- Classements des compétitions (Hugging Face, Kaggle)
- Documents académiques
⚖️ Comparer et analyser des données
Une fois les données collectées, recherchez des modèles, des tendances et des lacunes. Utilisez un tableau de comparaison pour visualiser les données (voir l'exemple ci-dessous).
Questions à poser :
- Quels sont les indicateurs qui dépassent ou sont inférieurs à la moyenne du secteur ?
- Où les concurrents sont-ils performants et où sont-ils moins performants ?
- Quels sont les domaines dans lesquels il est possible de différencier votre solution de la norme ?
Enfin, traduisez vos conclusions en actions : fixez des objectifs mesurables pour votre solution, donnez la priorité aux améliorations les plus importantes pour les utilisateurs et identifiez les possibilités de vous démarquer.
Voici un exemple de tableau comparatif. Créez votre propre comparaison sur la base de vos recherches. L'activité ci-dessous propose un modèle similaire pour vous aider à visualiser et à comparer.
Métrique/Concurrent
Référence de l'industrie
Calme
Wysa
Espace de tête
Notre solution
Rétention de 30 jours
3.7%
4%
3.5%
3.2%
Pas encore testé
Conformité SOC2
de type I Type II
Type II
Non trouvé
Type II
Viser le type II
Prix moyen de l'abonnement
7-10 $/mois
12 $/mois
8 $/mois
13 $/mois
9 $/mois
Taille du marché
Il est important de comprendre qui est votre marché, mais il est également extrêmement important de comprendre quelle est sa taille. La taille du marché est une estimation du nombre de personnes susceptibles d'utiliser votre produit ou service et du chiffre d'affaires que cette opportunité pourrait générer. Connaître ces informations vous aide à prendre de meilleures décisions quant aux domaines sur lesquels vous concentrer, à la manière de vous développer et à la façon d'expliquer le potentiel de votre entreprise aux investisseurs ou partenaires.
Avant de calculer les chiffres, il est utile de comprendre trois termes clés utilisés par les startups pour définir les opportunités de marché : TAM (marché adressable total), SAM (marché disponible exploitable), et SOM (marché accessible et exploitable).

Ces termes fournissent un cadre pour réfléchir à votre opportunité, depuis le marché le plus large possible jusqu'à ce qui est réaliste d'atteindre dès le début. À ce stade, votre objectif devrait être un SOM réaliste, mais important. Vous devriez également réfléchir à des plans futurs pour élargir votre SOM afin de mieux conquérir l'ensemble du marché.
Vous commencez par un chiffre global (TAM), puis vous le réduisez à des chiffres plus réalistes (SAM) pour obtenir des objectifs réalisables à court terme (SOM). Voyons plus en détail ce que sont le TAM, le SAM et le SOM, et comment les calculer.
Marché potentiel total (TAM)
TAM (marché adressable total) correspond au chiffre d'affaires total que vous pourriez réaliser si tous les clients potentiels utilisaient votre produit. Votre TAM vous donne une idée de l'ampleur totale de l'opportunité dans laquelle vous vous lancez. Il vous aide à comprendre si le problème que vous résolvez concerne un petit créneau ou des millions de personnes, et si le potentiel à long terme de votre idée est suffisamment important pour soutenir une entreprise.
Lorsque les investisseurs examinent une start-up, ils se penchent souvent en premier lieu sur le TAM, car celui-ci répond à une question simple : Cette opportunité est-elle suffisamment importante pour mériter d'être exploitée ? Un TAM clair vous aide à expliquer l'avenir plus large vers lequel vous vous dirigez, même si vous n'atteindrez pas ce marché immédiatement.
Où trouver les chiffres :
Données publiques : Statistiques gouvernementales, associations industrielles ou données de l'ONU/Banque mondiale pour les estimations mondiales.
Rapports sectoriels : Les cabinets d'études de marché publient souvent des estimations de la taille du marché.
Produits comparables : Consultez les rapports sur les marchés similaires ou les concurrents et adaptez-les à votre produit.
Sondages ou outils en ligne : Réalisez des enquêtes simples ou utilisez des plateformes telles que Google Trends pour estimer la demande.
Exemple :
Imaginez que vous développiez une application d'apprentissage des langues. Pour estimer le TAM, commencez par poser une question générale : Combien de personnes dans le monde essaient d'apprendre une nouvelle langue chaque année ?
Vous consultez les rapports sectoriels et constatez qu'environ 1 000 000 de personnes dépensent activement de l'argent pour des outils d'apprentissage des langues. Si votre application coûte 50 $ par an, alors votre TAM est de :
1 000 000 clients x 50 $ = 50 000 000 $
Marché potentiel exploitable (SAM)
SAM (marché disponible exploitable) est la partie du TAM que votre startup peut réellement desservir compte tenu de votre produit, de vos ressources et de votre situation géographique. Le SAM ancrent votre idée dans la réalité. Il réduit l'immense paysage représenté par le TAM au segment que vous pouvez réellement atteindre en fonction de votre produit, de votre public cible et de vos contraintes actuelles. Comprendre votre SAM vous aide à concentrer votre énergie. Quelle partie du marché devriez-vous vraiment cibler pour le moment ?
Cela vous aide également à éviter d'essayer de créer un produit pour « tout le monde », ce qui conduit généralement à un produit qui ne trouve aucun écho auprès de personne. Un SAM bien défini montre que vous comprenez qui vous pouvez servir aujourd'hui et comment votre produit s'intègre véritablement dans leur vie.
Comment calculer :
- Commencez par votre TAM.
- Données démographiques : Affinez votre recherche par âge, revenu ou centres d'intérêt.
- Géographie : Limitez-vous aux pays ou régions où votre produit peut actuellement être distribué.
- Type de client : Concentrez-vous sur le groupe spécifique de personnes qui peuvent réellement utiliser votre produit dès maintenant en fonction de leur accès, de leurs besoins et de leur disposition. Excluez les groupes que vous ne pouvez pas encore servir, comme les utilisateurs qui ne disposent pas de la technologie appropriée, qui ont besoin de fonctionnalités avancées que vous n'avez pas encore développées ou qui vivent dans des régions que vous ne pouvez pas atteindre.
- De plus, vous pouvez utiliser des sondages, des groupes de discussion ou les données clients de vos concurrents pour estimer votre segment accessible.
Exemple :
Réduisez cette valeur TAM mondiale élevée au segment spécifique que vous pouvez réellement desservir. Peut-être que votre application ne sera lancée dans certains pays dans un premier temps, et que ces pays représentent 20 % du marché mondial de l'apprentissage des langues. Votre SAM devient donc :
50 000 000 $ (TAM) × 20 % = 10 000 000 $
Marché exploitable accessible (SOM)
SOM (marché exploitable) est la part du SAM que vous pouvez conquérir à court terme, souvent lors de votre premier lancement ou au cours de votre première année. Le SOM ramène tout à la phase la plus précoce de votre démarrage : la traction que vous pouvez raisonnablement espérer lors de votre lancement. Ce chiffre vous aide à fixer des objectifs pratiques pour votre première année, tels que le nombre de clients que vous pourriez acquérir, les revenus que vous pourriez générer et ce à quoi devrait ressembler votre succès au début.
SOM vous aide également à réfléchir honnêtement à vos ressources, à la concurrence et à votre stratégie de commercialisation. Pour les investisseurs, SOM montre que vous ne vous contentez pas de rêver en grand. Vous comprenez comment la croissance se produit réellement et vous êtes capable de définir les premières étapes réalisables.
Où trouver les chiffres :
Analyse de la concurrence : Estimez la part de marché conquise par des startups similaires à leurs débuts.
Budget marketing et portée : Évaluez le nombre de clients que vous pouvez réellement atteindre avec vos canaux actuels.
Études pilotes ou tests préalables au lancement : Les premiers intéressés, les inscriptions ou les utilisateurs bêta fournissent des données concrètes.
Avis d'expert : Les mentors ou conseillers peuvent fournir des pourcentages d'adoption réalistes.
Exemple :
Enfin, posez-vous la question suivante : Sur les 10 millions de dollars de SAM que nous pouvons réellement atteindre, combien pouvons-nous espérer capturer dès le début ? Si les études montrent que les applications similaires remportent généralement 5 % de leur marché accessible au cours de leur première année, alors votre SOM est de :
10 000 000 $ (SAM) × 5 % = 500 000 $
Voici comment raconter votre histoire à l'aide de votre étude sur la taille du marché :
TAM : « Le marché mondial de l'apprentissage des langues représente 50 millions de dollars par an. »
SAM : « Nous démarrons dans trois pays où nous pouvons réellement aider les apprenants, ce qui représente une opportunité de 10 millions de dollars. »
SOM : « Sur la base des résultats obtenus par des applications similaires, nous prévoyons de générer 500 000 dollars de revenus la première année en acquérant 10 000 utilisateurs payants. »
Vous montrez que vous comprenez la situation dans son ensemble (TAM), vous êtes réaliste quant à votre point de départ (SAM) et vous fixez un objectif réalisable pour la première année (SOM).
Avertissement concernant la taille du marché
Il est tentant de gonfler ces chiffres. « Notre TAM est de 10 milliards de dollars ! » semble impressionnant, mais si ce n'est pas crédible, cela peut en réalité vous nuire. Les investisseurs et les mentors peuvent immédiatement repérer les tailles de marché gonflées.
Il vaut mieux avoir un chiffre plus petit, mais bien documenté, qu'un chiffre énorme sorti de nulle part. Si votre TAM est vraiment petit, c'est une information précieuse : cela peut signifier que vous devez développer votre solution, trouver des marchés adjacents ou reconsidérer l'opportunité.
Social Listening & Trend Analysis
L'écoute sociale et l'analyse des tendances consistent à observer à la fois les conversations en ligne et les tendances plus générales du marché afin d'identifier les opportunités, les lacunes et les tendances émergentes. Vous avez écouté directement vos parties prenantes par le biais d'entretiens afin de valider votre problème et votre solution. L'écoute sociale est différente car elle observe les conversations naturelles, recueille des opinions plus spontanées et touche un public beaucoup plus large.
L'écoute sociale se concentre sur les discussions en temps réel en surveillant les médias sociaux, les forums, les critiques et d'autres plateformes en ligne pour voir ce que les utilisateurs disent sur les problèmes, les produits ou les solutions. L'analyse des tendances s'intéresse aux évolutions du secteur, à l'activité des concurrents et aux technologies émergentes susceptibles d'affecter votre marché. Une tendance est identifiée lorsqu'un sujet, un comportement ou un besoin apparaît de manière cohérente dans plusieurs sources, persiste dans le temps ou suscite un engagement croissant.
Cette vidéo donne un bon aperçu de l'écoute sociale.
Les étapes ci-dessous vous aideront à comprendre ce que les utilisateurs apprécient, les lacunes des solutions actuelles et la manière dont votre idée peut se démarquer. En combinant les connaissances des utilisateurs et les tendances du marché, vous pourrez prendre des décisions éclairées sur les caractéristiques, le message et le positionnement.
🔍 Identifier les sources
Concentrez-vous sur les plateformes où votre public cible est actif, telles que WhatsApp, X, Instagram, TikTok, LinkedIn, ou les forums et communautés spécialisés où les utilisateurs potentiels partagent leurs pensées et leurs opinions sur des problèmes et des produits.
📈 Analyse des tendances
Il existe de nombreuses sources permettant de se faire une idée des grandes tendances du marché. Les blogs sectoriels (comme la Harvard Business Review), des données d'organisations à but non lucratif ou de gouvernements (comme la Banque mondiale), des bulletins d'information, des rapports d'étude de marché (tels que Statista ou en effectuant une recherche à l'aide de Google Dataset Search) et les organes de presse peuvent également donner un aperçu des grandes tendances.
🧠 Choisir des mots-clés et des thèmes pertinents
Pensez au problème auquel votre solution répond, aux termes connexes, aux concurrents et aux expressions courantes du secteur. En utilisant les bons mots-clés, vous vous assurez d'obtenir des conversations et des données significatives.
👀 Moniteur
Des outils tels que les alertes Google ou les fonctions de recherche des plateformes de médias sociaux peuvent vous aider à suivre les conversations. Un suivi régulier vous permet d'observer les tendances émergentes plutôt que de vous fier à des messages isolés. Il peut également être utile de compiler les articles et les données pertinentes en un seul endroit dans vos notes. Vous pouvez enregistrer le nombre de mentions, de messages ou de mesures d'engagement au fil du temps pour voir quels sont les sujets qui prennent de l'ampleur ou qui persistent dans plusieurs sources.
📊 Analyser les informations
Recherchez les thèmes, questions ou plaintes récurrents. Les schémas peuvent révéler ce qui préoccupe le plus les utilisateurs, les fonctionnalités les plus demandées ou les domaines dans lesquels les concurrents ne sont pas à la hauteur. La visualisation des données à l'aide de graphiques, de nuages de mots ou de courbes de tendance permet de repérer plus facilement les informations clés et de les communiquer à votre équipe.
🚀Take Action
Utilisez les informations recueillies pour affiner votre solution ou votre stratégie. L'écoute sociale permet d'améliorer les fonctionnalités et d'ajuster l'expérience utilisateur, tandis que l'analyse des tendances permet de hiérarchiser les fonctionnalités et d'élaborer des stratégies de marketing.
Exemple : Social Listening pour une application de livraison de nourriture
Imaginez que vous trouviez ces trois messages sur les médias sociaux à propos d'une application de livraison de nourriture.
- Quels enseignements pouvez-vous tirer de ces articles ?
- Quelles actions votre équipe pourrait-elle entreprendre sur la base de ces informations pour améliorer votre solution ou mieux répondre aux besoins des utilisateurs ?
Par exemple, ces informations pourraient conduire l'équipe à privilégier une livraison plus rapide : Ces informations pourraient amener l'équipe à privilégier une livraison plus rapide, à s'associer à des restaurants locaux sains ou à mettre en avant ces caractéristiques dans leur marketing pour différencier leur solution.

Exemple : Identifier une tendance à partir de données de marché
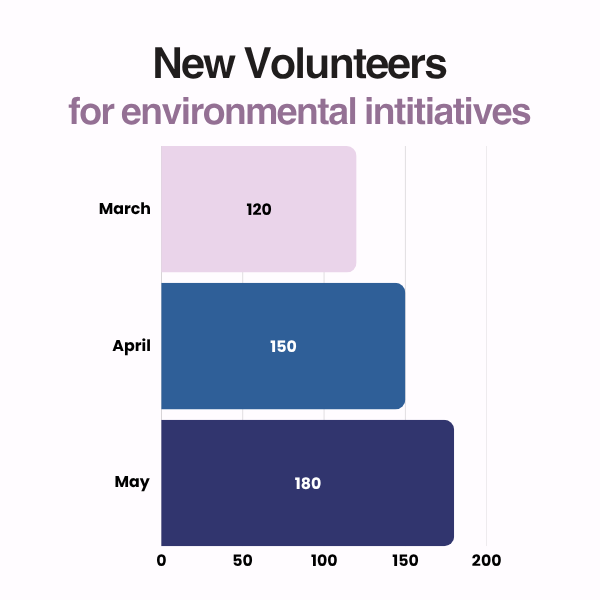
Imaginez que vous étudiez les tendances en matière d'engagement bénévole dans le cadre d'initiatives locales en faveur de l'environnement. Au cours des trois derniers mois, vous avez suivi des articles de presse, des bulletins d'information d'organisations à but non lucratif et des rapports publics sur l'engagement des bénévoles. Le nombre de nouveaux bénévoles chaque mois pour le programme local "planter un arbre" est indiqué dans le graphique.
Vous observez alors que les inscriptions de bénévoles aux programmes environnementaux augmentent régulièrement et identifiez la tendance d'un intérêt et d'une participation croissants de la communauté aux efforts locaux en matière d'environnement.
RECHERCHE APPROFONDIE AVEC L'IA
Vous avez identifié vos principaux concurrents et appris à les connaître grâce à l'IA. Mais vous avez besoin d'informations plus approfondies sur votre marché, telles que les tendances du secteur, les points faibles des clients, les références et les meilleures pratiques des entreprises prospères, afin d'avoir une vision complète et exhaustive.
Deep Research est une fonctionnalité présente dans certains outils d'IA qui va au-delà des questions simples. Au lieu de répondre à partir de leur mémoire, les outils de recherche approfondie parcourent le Web, lisent des centaines de sources et synthétisent leurs résultats dans un rapport complet.
Lorsque vous utilisez Deep Research :
- L'IA reçoit votre question
- Il crée un plan de recherche et le divise en tâches plus petites.
- Il effectue des recherches sur le Web et lit des centaines d'articles, de rapports et de sites Web.
- Il synthétise les résultats dans un rapport structuré de plusieurs pages.
- Il vous renvoie le rapport (cela peut prendre entre 5 et 10 minutes, parfois plus).
Vous pouvez quitter votre ordinateur pendant qu'il fonctionne. Deep Research s'exécute en arrière-plan sur les serveurs de Google. Vous pouvez fermer votre navigateur, passer à une autre application ou même éteindre votre ordinateur. Lorsque le rapport sera prêt, Gemini vous en informera. Cela signifie que vous n'avez pas besoin de rester connecté pendant le temps d'attente.
Cela diffère des chats IA classiques, qui répondent instantanément mais utilisent uniquement les connaissances acquises lors de l'entraînement de l'IA.
Quelles sont les meilleures recherches approfondies pour
Deep Research excelle dans la collecte d'informations mondiales provenant de nombreuses sources en ligne.
|
Besoin en matière de recherche
|
Une recherche approfondie aide à
|
Exemple
|
|---|---|---|
|
Références du secteur
|
Indicateurs, normes, taux de croissance
|
« Quel est le coût moyen d'acquisition d'utilisateurs pour les applications de livraison de repas ? »
|
|
Problèmes rencontrés par les clients
|
Plaintes agrégées provenant d'avis publiés dans le monde entier
|
« Quelles sont les plaintes des clients concernant les applications de transport existantes ? »
|
|
Tendances du marché
|
Technologies émergentes, évolutions du marché
|
« Quelles tendances façonnent le secteur du marché artisanal ? »
|
|
Meilleures pratiques
|
Comment fonctionnent les entreprises prospères
|
« Comment les plateformes reliant les agriculteurs aux restaurants ont-elles connu un tel succès ? »
|
|
Recherche sur les prix
|
Modèles de tarification courants dans votre secteur d'activité
|
« Quelles stratégies tarifaires les applications de santé mentale utilisent-elles ? »
|
Ce pour quoi Deep Research n'est pas adapté
Deep Research s'appuie sur des sources mondiales, principalement anglophones. Il peut être moins utile pour :
- Trouver des concurrents locaux sur les marchés régionaux plus petits (votre outil de recherche de concurrents + vos propres connaissances sont plus efficaces pour cela)
- Tarifs locaux et conditions du marché propres à votre ville ou à votre pays
- Réglementations spécifiques à chaque région (à rechercher auprès des autorités locales)
Pour vos études de marché, utilisez Deep Research pour le contexte mondial (tendances, repères, points faibles) et combinez-le avec vos connaissances locales et à une recherche manuelle pour les spécificités régionales.
Options de l'outil
Différents outils d'IA offrent des fonctionnalités de recherche approfondie :
|
Outil
|
Comment accéder
|
Niveau gratuit
|
Idéal pour
|
|---|---|---|---|
|
Recherche approfondie sur Gemini
|
~5 requêtes/jour
|
Recherche approfondie sur Internet
|
|
|
Perplexité.ai
|
5 requêtes Pro par jour
|
Recherche rapide avec sources
|
|
|
ChatGPT Parcourir
|
Abonnement ChatGPT Plus
|
Rémunéré uniquement
|
Si vous avez déjà Plus
|
Important : Si Gemini n'est pas disponible dans votre région, utilisez Perplexity.ai comme alternative. Les deux produisent de bons résultats de recherche.
ACTIVITÉ 2
Mener des recherches approfondies
Durée estimée : 60 minutes
Dans cette activité, vous utiliserez Deep Research pour recueillir des informations détaillées. Suivez les étapes ci-dessous pour chacun des sujets de recherche suivants :
- Thème 1 : Références sectorielles et exemples de réussite (excellent pour fixer des objectifs et apprendre les meilleures pratiques)
- Thème 2 : Recherche sur les 3 indicateurs permettant d'évaluer la taille du marché dans votre domaine de solution
- Thème 3 : Écoute sociale et tendances de recherche dans votre marché ou votre secteur d'activité (excellent pour identifier les opportunités et les menaces)
- Thème 4 : Identifiez les points faibles des clients avec les solutions existantes (excellent pour identifier les opportunités)
1. Ouvrez votre outil Deep Research.
Si vous utilisez Gemini :
- Accédez à gemini.google.com dans votre navigateur.
- Connectez-vous avec votre compte Google
- Recherchez « Recherche approfondie » dans l'interface (peut apparaître sous forme de bouton ou d'option).
Si vous utilisez Perplexity.ai:
- Aller à perplexity.ai dans votre navigateur
- Cliquez sur « S'inscrire » pour créer un compte gratuit (vous pouvez utiliser Google ou votre adresse e-mail).
- Une fois connecté, vous verrez un champ de recherche au centre de la page.
- Tapez votre question de recherche dans le champ de recherche.
- Cliquez sur le bouton de recherche ou appuyez sur Entrée.
- Perplexity effectuera une recherche sur le Web et affichera les résultats avec les citations des sources.
- Pour approfondir vos recherches, utilisez l'option « Recherche avancée » (limitée à 5 par jour dans la version gratuite).
Remarque : Perplexity indique les sources de chaque affirmation, ce qui facilite la vérification des informations. Les résultats s'affichent plus rapidement qu'avec Gemini Deep Research (généralement en 1 à 2 minutes au lieu de 5 à 10 minutes).
2. Rédigez votre sujet de recherche
Pour chaque sujet de recherche ci-dessous, vous devrez fournir une question qui couvre tous les éléments sur lesquels vous souhaitez en savoir plus. Vous pouvez soit créer votre propre question, soit utiliser les modèles et suggestions fournis.
Planifiez soigneusement vos requêtes.
Rédigez votre question avant de la soumettre afin d'éviter de gaspiller une requête sur une invite mal formulée.
Limites du niveau gratuit :
- Gemini : environ 5 requêtes de recherche approfondie par jour
- Perplexité : 5 recherches Pro par jour dans le cadre de l'offre gratuite
Analyse comparative de l'industrie
Je développe [brève description de votre solution] dans le domaine [secteur/marché] afin de résoudre [brève description de votre problème].
[copiez et collez tout ou partie des questions figurant dans la fiche de travail sur l'analyse comparative du secteur]
Taille du marché
Je développe [brève description de votre solution] dans le domaine [secteur/marché] afin de résoudre [brève description de votre problème]. J'ai identifié mon marché cible comme étant [liste du marché cible].
Veuillez fournir les chiffres relatifs au marché potentiel total (TAM), au marché disponible exploitable (SAM) et au marché exploitable accessible (SOM) pour mon produit.
Fournissez également des liens vers les recherches qui étayent ces chiffres.
Écoute sociale et tendances du marché
Je développe [brève description de votre solution] dans le domaine [secteur/marché] afin de résoudre [brève description de votre problème].
J'ai identifié mon marché cible comme étant [liste du marché cible].
Fournir 2 à 3 plateformes en ligne où mon public cible est actif.
Trouver des mots-clés, des hashtags ou des communautés pertinents liés au problème que je résous ou à ma solution.
Notez les thèmes récurrents, les frustrations ou les suggestions.
Problèmes rencontrés par les clients
Mes principaux concurrents sont [énumérez 3 à 5 des principaux concurrents de l'activité 1].
Regardez :
- Avis sur les boutiques d'applications, les sites d'évaluation de logiciels et les réseaux sociaux
- Plaintes courantes concernant les solutions actuelles
- Fonctionnalités que les clients aimeraient voir existantes
- Raisons pour lesquelles les clients changent de produit
- Groupes d'utilisateurs ou cas d'utilisation mal desservis
Donnez des exemples précis et des citations lorsque cela est possible.
3. Soumettez votre demande et attendez les résultats.
Une recherche approfondie prend du temps, car elle nécessite la lecture de centaines de sources. Prévoyez un délai de 5 à 10 minutes, voire plus pour les sujets complexes !
Une fois la recherche terminée, assurez-vous de lire attentivement le rapport complet, puis copier le rapport dans un document pour référence future.
4. Consigner les résultats
- Copiez et collez les invites et les réponses dans les feuilles de travail fournies ou dans un nouveau document Google.
- Examinez attentivement les réponses et ajoutez des notes.
- Revenez à l'outil d'IA que vous utilisez et demandez des éclaircissements si nécessaire, ou passez à un LLM standard pour le suivi si vous n'avez plus de crédits.
Vous vous sentez coincé ?
|
Problème
|
Solution
|
|---|---|
|
Recherche approfondie prenant plus de 15 minutes
|
Ceci est plus long que d'habitude. Essayez de rafraîchir la page. Si le traitement est toujours en cours, lancez une nouvelle requête.
|
|
Impossible de trouver l'option Deep Research dans Gemini
|
Assurez-vous que vous êtes bien sur gemini.google.com (et non sur l'API). Recherchez le bouton « Deep Research » ou le sélecteur de mode.
|
|
Les résultats sont trop généraux.
|
Ajoutez plus de détails à votre demande. Indiquez votre secteur d'activité, votre emplacement et votre public cible.
|
|
Limite du niveau gratuit atteinte
|
Passez à l'outil alternatif (Perplexity si vous utilisiez Gemini). Vous pouvez continuer demain.
|
|
Outil non disponible dans ma région
|
Utilisez Perplexity.ai, qui offre une plus grande disponibilité.
|
Analyse SWOT
Une analyse SWOT est un outil structuré utilisé pour évaluer votre solution d'un point de vue interne et externe. Une analyse SWOT peut intégrer toutes les informations que vous avez obtenues grâce aux autres analyses que vous avez effectuées dans le cadre de votre étude de marché.
Il vous aide à comprendre votre :
Points forts
Les points forts de votre solution
Ce que vous avez : Des compétences, des ressources ou un accès que d'autres n'ont pas.
Ce que vous avez prouvé : Des idées ou des hypothèses déjà validées par des tests auprès des utilisateurs.
Ce qui vous distingue : Une expertise dans le domaine, une perspective unique ou des connaissances spécialisées qui donnent à votre équipe une longueur d'avance.
Faiblesses
Les points à améliorer dans votre solution
Ce qui vous manque : Compétences, ressources ou outils spécifiques dont votre équipe ne dispose pas encore.
Ce que les utilisateurs ont remarqué : Commentaires ou critiques recueillis lors d'entretiens ou de tests.
Ce qui vous préoccupe : Les aspects de l'exécution ou de la livraison qui pourraient poser des problèmes.
Opportunités
Possibilités de croissance
Pourquoi maintenant ? Les évolutions du marché ou les facteurs temporels qui font que c'est le bon moment pour votre solution.
Qui d'autre pourriez-vous servir ? Segments d'utilisateurs adjacents ou négligés qui s'alignent sur votre mission.
Qui pourrait vous aider ? Partenariats, réseaux ou ressources dans lesquels vous pourriez puiser pour accroître votre impact.
Menaces
Risques externes à surveiller
Qui d'autre est en concurrence ? Les concurrents existants ou les solutions alternatives dans l'espace.
Ce qui pourrait changer : Technologies, tendances ou comportements des utilisateurs qui pourraient rendre votre solution moins pertinente.
Ce qui pourrait vous bloquer : Les contraintes externes telles que les réglementations, les limites de financement ou les barrières commerciales.
Avec toutes les informations recueillies, le moment est venu de synthétiser vos résultats afin d'obtenir une image claire de votre plan stratégique et d'affiner éventuellement votre solution. Le SWOT est un moyen succinct, mais puissant, de commencer à synthétiser les informations que vous avez recueillies jusqu'à présent et d'identifier les facteurs clés de la réussite de votre équipe.
ACTIVITÉ 3
Analyse SWOT et planification stratégique
Durée estimée : 60 minutes
Dans cette activité, avec l'aide de l'IA, vous allez :
- Effectuez une analyse SWOT de votre idée à l'aide du modèle fourni.
- Sur la base de l'analyse SWOT, remplissez le plan d'action stratégique résultant de vos conclusions.
1. Ouvrez votre outil Deep Research.
Ouvrez l'outil de votre choix parmi ceux proposés ci-dessus pour effectuer vos recherches approfondies.
Notez que vous devrez peut-être patienter si vous n'avez plus de crédits.
2. Créez vos invites à l'aide de la feuille de travail.
- Créez une invite pour remplir le tableau SWOT dans la feuille de calcul. Si vous êtes dans le même fil de discussion, l'outil d'IA devrait déjà disposer du contexte de votre problème, de votre marché et de votre solution.
Vous pouvez également fournir des liens vers les documents de recherche précédents afin de donner plus de contexte si nécessaire. - Ensuite, rédigez une autre consigne pour compléter la section « planification stratégique » de la fiche de travail.
4. Consigner les résultats
- Copiez et collez les invites et les réponses dans la feuille de travail.
- Examinez attentivement les réponses et ajoutez des notes.
- Apportez les modifications nécessaires, continuez à poser des questions et modifiez tout ce qui ne vous convient pas dans les réponses.
N'oubliez pas que l'IA se charge du travail fastidieux de synthèse et d'analyse des informations. En tant que fondateur, il est toujours important que vous exposiez vos propres idées et que vous réfléchissiez profondément à vos forces, vos faiblesses, vos opportunités et vos menaces.
Utilisez l'IA comme un assistant, et non comme la réponse définitive à vos recherches.
Synthèse de l'étude de marché
Vous avez maintenant utilisé plusieurs méthodes de recherche pour en savoir plus sur votre marché. Mais ne vous contentez pas de solliciter l'IA, de remplir les feuilles de travail et de vous arrêter là. Il est judicieux de résumer ce que vous avez appris et d'élaborer un plan d'action pour garantir votre réussite. Cette synthèse vous aidera à déterminer les caractéristiques de votre produit minimum viable (MVP). Elle vous permettra également de remplir votre prochain document commercial important, votre lean canvas.
Voici quelques catégories pour organiser vos résultats :
1
Paysage concurrentiel
- Quels sont les points forts communs aux concurrents ?
- Quelles sont les faiblesses les plus courantes ?
- Quelles sont les lacunes que personne n'a réussi à combler ?
2
Normes du marché (issues de l'analyse comparative)
- Quels sont les paramètres qui définissent le succès dans votre espace ?
- Quelles sont les attentes des utilisateurs ?
- Où le marché est-il sous-performant ?
3
Sentiment des utilisateurs
- Quelles sont les frustrations récurrentes ?
- Quel langage les utilisateurs utilisent-ils pour décrire leurs problèmes ?
- Quelles sont les tendances qui se dessinent dans les besoins et le comportement des utilisateurs ?
4
Votre position stratégique (contexte concurrentiel + normes du marché + sentiment des utilisateurs)
- Votre proposition de valeur unique : En quoi êtes-vous différent et meilleur ?
- Vos indicateurs cibles : Quels sont les critères de référence que vous souhaitez dépasser ?
- Quel est votre plus grand risque ?
Réflexion
N'oubliez pas que l'étude de marché est un processus itératif. Les enseignements tirés d'un cycle de recherche peuvent conduire à de nouvelles questions ou idées, que vous pouvez continuer à explorer à l'avenir. Prenez quelques instants pour réfléchir à ce que vous avez appris et à la manière dont cela peut façonner votre solution.

Recherche de concurrents
Social Listening
Analyse SWOT
Une IA prudente
Ressources complémentaires
- Le guide ultime de la recherche concurrentielle pour les petites entreprises - Entrepreneur
- Benchmarks sectoriels et esprit d'entreprise - FasterCapital
- Exemples d'analyse SWOT : Des petites entreprises aux startups et aux grandes sociétés - Business News Daily
Recherche de concurrents
- Crunchbase — Base de données sur les start-ups et les entreprises
- Product Hunt — Découvrez de nouveaux produits et concurrents
- G2 — Critiques et comparaisons de logiciels