Flowcharts
Coding 15
In this lesson, you will…
- Learn how to create flowcharts
- Create one flowchart
Key Terms
- Flowchart - a diagram that represents an algorithm using shapes and arrows


Flowcharts
A flowchart is a diagram that represents an algorithm. It is read from top to bottom and uses shapes and arrows to show what happens in a program. You and your team can use flowcharts to help plan out how to create your code and organize your code.
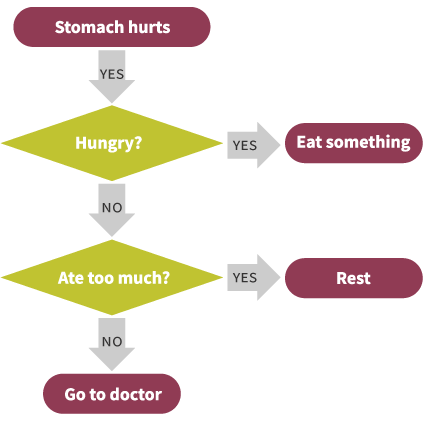
Here is an example of an algorithm for finding out why someone’s stomach hurts:
![]()
An oval shows where the algorithm starts and ends In the example above, there are three different places where the algorithm may end, either the person needs to eat something, they need to rest, or they need to see a doctor. These are called terminals.

A diamond shows where a decision needs to be made. They are like “forks in the road”. This is whenever a conditional needs to decide true or false for a condition. Two arrows should come out of a decision, one for true and one for false. Note how the arrows come out of the diamond in the example above, one comes out from the bottom and one from the side.
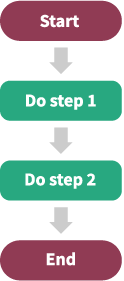
Here’s another example of a flowchart:
![]()
This diagram uses a rectangle, which represents a process. A process is whatever you are having your code do. It could be alerting a user, setting a label to say something or adding two numbers together.
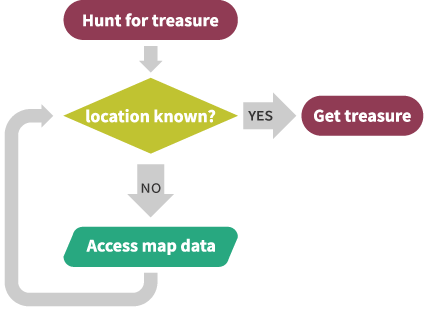
Here’s another example of a flowchart:
![]()
The last shape you should be aware of is the parallelogram. You should use this shape whenever you need to get data from a user or from somewhere else, like a website. The parallelogram is for inputs.
Activity: Create a Flowchart
In this activity, you will create one flowchart. With your team, write out some pseudocode for one algorithm you are going to use in your app. Once you are done, follow the instructions below.
![]()
1. Put an oval around the beginning and end of your event handler. This is called a terminal. There is often more than one ending to a flowchart. In the search button example above, the event handler ends either by displaying the search results in a listview or by notifying the user that there are no matches.
2. Put a diamond around where a decision needs to be made. This is whenever the app needs to decide true or false for a condition. Remember, conditionals can lead to more than one possibility for the ending.
![]()
3. Add a parallelogram around all the inputs in your code or the places where you are getting data from either the user or another place, like a website or local database.
![]()
4. Put a rectangle around all of the processes in your code. This is whenever your app is doing something that doesn’t fall into the categories above. This could be adding items to a list or sending an alert to the user.
![]()
5. Connect it all together with arrows! Pay special attention to how you are drawing the arrows for loops and conditionals and refer to the examples above if you need help.
Reflection
Flowcharts are a great way to help plan out your code and understand what you will need to program your app. Now that you’ve completed all the coding lessons, think back on everything you've learned and, with your team, start planning and creating a flowchart of your source code!
Additional Resources: More Practice and Online Tools
Want a bit more practice with flowcharts? You can either try making a flowchart of some of the activities in previous coding lessons or try making a flowchart of pseudocode with everyday activities. For example, what would a flowchart of making tea look like?
Remember this?
Way back in Coding 1, you saw two videos from the MIT App Inventor team that walked through the process of building an app. Now that you've completed all the Coding lessons, watch these videos again and see how much you've learned! Use them as guidelines as your build your own app.